Fraud and deceit – some things to watch for
I am so disgusted and enraged with the fraudsters and scammers out there that I just had to write this post. There has been major fraud at PFGBest, MF Global and Barclay’s recently and many others (especially Ponzi schemes) over the years. They are the easy ones to see – I’m not addressing them right now. There are many more that aren’t so easy to spot, especially in the trading system world (unfortunately!). I want to share an example so you can be better prepared when doing your due diligence about trading systems.
I just attended a webinar for an emini scalping strategy. I attend webinars every once in a while if it looks like something I haven’t seen before. Well – I’ve seen this before unfortunately. I hadn’t seen this particular vendor but I have seen this type of deception before.
This vendor showed charts in TradeStation with entries and exits displayed and the indicators showing what triggered the entries and exits. They then show these great trading performance results (no losing months) which even include $5 for commission – sounds good so far right?
Then he says something strange – “this is not an automated system, you have to manually enter the trades”. Huh? He just showed a trading strategy in TradeStation (which is how he generates all the performance results he shows) and says you can’t run it automated, you have to enter trades manually. Well, I know with 100% certainty that this system he is displaying can be run fully automated in TradeStation, so I ask him “why not run it fully automated?” No answer. He keeps saying “any more questions” and ignores my question. Red flag goes up.
I ask myself “why would he say it can’t be traded automated?” and it hits me – he is not including slippage. You know, the spread, the difference between the bid and ask? Except for limit orders, buy orders are filled at the ask and sell orders are filled at the bid. This is one of the costs of trading that must be accounted for. I asked the host/presenter if he included slippage in the results…..no answer. He shows a section of the report where the slippage used is displayed – it shows 0 (no slippage included). So now I ask why he didn’t include slippage in the results….again no answer. I make some comments about the deceitfulness of not including slippage in the results….no answer.
When he showed the performance results for the past few months I quickly noted the net profit and number of trades of the most profitable month. I then divided that month’s profit by the number of trades and came up with $20 per trade. This is for the ES (emini S&P) where the spread is always a minimum of one tick ($12.50). So the slippage cost per trade is $12.50 at entry and $12.50 at exit. That is $25 per trade. So the real average trade is $20 – $25 = -$5. Yes, negative, a $5 loss per trade! And this is for his best month! This strategy he is showing and selling to people is really a loser, yet the results he is displaying shows all winning months!
Now it is clear to me this is a scam – the presenter knows he is being deceitful or he would address my questions. Also, he only sells his system – he doesn’t lease it. Know why? Because he knows it doesn’t work so he wants to get all of your money up front. Disgusting.
I’ve seen this enough times I guess it shouldn’t get to me but it still does. The reason why is that there are real people that are going to give this guy their real money and then trade it with real money and lose even more! And this guy doesn’t care – he just wants your money.
Please do your due diligence when considering investments. Do not fall for the quick sale. If they say “to get this discount price you have until midnight tonight”, run away immediately. When looking specifically at trading systems, here are two key questions to ask:
1) Are limit orders used? If so, the results they show are probably not possible in reality.
2) Are commission and slippage included in the results? If they don’t include both then the results they show are not possible in reality.
Asking at least those two questions should weed out most of the scammers. I hope none of you have been fooled by some of the tricks system vendors use, but odds are you probably have.
My condolences go out to the victims of the MF Global, PFGBest and all the other fraudsters and scammers out there. I sure hope your money is recouped as it rightfully should be.
Trendfinder’s systems continue top rankings in Futures Truth
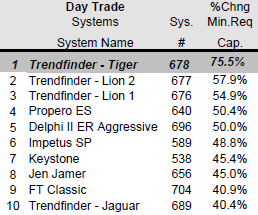
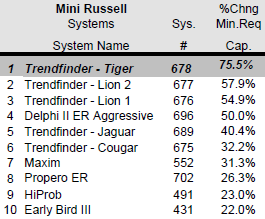
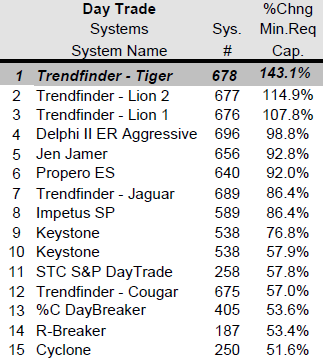
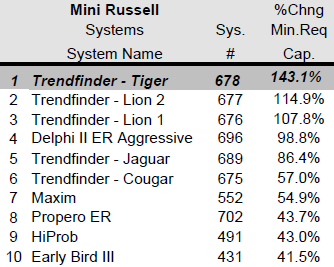
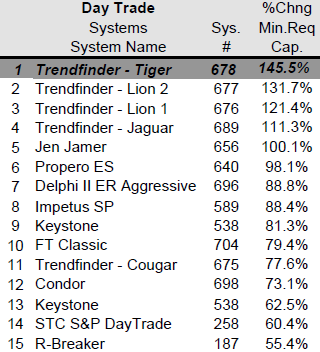
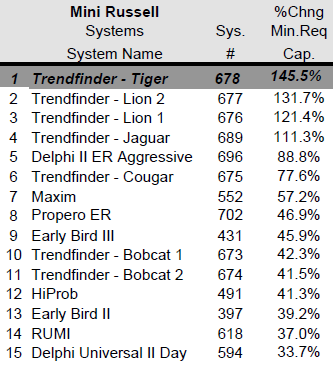
The latest issue of Futures Truth (#2-2012) came out today. Trendfinder’s systems again took the top 3 rankings for all Day Trade systems and all Mini Russell systems. Lion, Lion II and Tiger were also ranked in their Top Ten Tables for all systems “since release date” and for “past 12 months”.
Trendfinder’s systems now available in WideTrader
I am pleased to announce that all of Trendfinder’s systems may now be used with Wide Trader. For those that want to manage trading themselves, Wide Trader is a great choice. You may either set up the trades to be automatically executed or just receive the signals and enter/exit the trades manually. The program runs on your own computer or server and receives the signals from Trendfinder’s server. With Wide Trader you will see the real-time position and entry price for each system you are subscribed to. For a list of brokers that support Wide Trader, please go here.
If you have any questions please contact Gary or contact Wide Trader.
Wide Trader works as an interface between signals automatically produced by consultants specialized in the study and development of systems and brokers supporting electronic order entry. Wide Trader makes it possible to operate automatically on the financial markets with no need for the operator to perform any action. The operator is however simultaneously and precisely informed of any operations performed or of any alarms thanks to a highly effective email/sms notification service.
Cougar II closed
Cougar II has exceeded its previous max historical drawdown by more than 50% so it is no longer being offered. It was not being used in any of the Portfolios so no changes are needed for them going forward.
The $3800 mistake
Even with fully automated trading systems there are errors since us mere humans are providing the input. I took a look at Tiger’s results recently since it wasn’t performing as well as I thought it should be. Guess what? I was right, and I made a mistake.
Tiger/Tiger Vol is re-optimized on a monthly basis with parameters updated going forward. I run the optimization in TradeStation and export the optimization results to Excel. There I add a column with my custom fitness algorithm and sort to determine the parameters to use going forward. When doing this I copy and paste the column’s formula from the previous month’s optimization. For years that has worked perfectly…until this March. For an unknown reason, the columns were exported in a different order in March and have been every month since. When I copied and pasted the formulas they were using an incorrect column in the calculations.
I went back and corrected the spreadsheets for March, April, May and the just completed June optimization. Then to see what difference it made I compared the results with the incorrect parameters and the correct ones.
Now the good and the bad news. The good news is that the correct parameters greatly improved the results, and the bad news is that the incorrect parameters (that were used in real-time) had a loss. The correct parameters had a $70 gain during this period and the incorrect ones had a $3730 loss, a difference of $3800! I would love to be able to go back in time and correct this mistake….and I apologize to those trading with Tiger. Tiger Vol would have had a $660 gain for the month of June instead of the $320 loss it had real-time. Again, I apologize for making this mistake. I assure you there won’t be any more copy and pasting! Or, if I do will be very diligent the correct columns are being used.
I could have just swept this under the rug and said nothing, but that doesn’t sit well with me. I believe in taking responsibility for ALL your actions – the good, bad and ugly. And if I didn’t report the mistake I made then I wouldn’t be taking responsibility.
Going forward Tiger Vol’s hypothetical results for 5 year performance on the website will be corrected to show what the system would have made using its rules correctly – this is to give a proper example of what to expect going forward. All blog results and “results since release” (being added to the website) will show the real-time results including the under-performance due to the mistake made during re-optimization.
New Systems Released with Volatility Filtering
The intraday systems perform best in markets with high volatility and under-perform during low volatility. To better control drawdowns, I have created new systems that only trade during markets with higher volatility. They use the VIX and/or the average daily range to determine the volatility of the market. They use varied measures to provide diversification (every system doesn’t use the exact same measure/filter).
To determine which existing systems to keep, I used an industry rule of thumb – if a system hasn’t exceeded 1.5 times its previous max historical drawdown then I kept that system. Cougar II and Lion met this criteria. I created new “Vol” versions for every system in addition to keeping Cougar II and Lion. As an added simplification/robustness alteration, the new systems do not automatically filter out any days (all the current systems filter out FOMC announcement days and most monthly options expiration days). You may trade the discontinued systems if you wish, however I will not be posting their results on the website or blog going forward.
Since these systems will be trading less frequently and could go weeks or even months without a trade, I will be reducing the lease fees. Also, to simplify the fee structures and encourage people to take a long-term view when trading these systems, the payment options are now based on 3 months or 1 year. See the leasing page for new pricing: http://trendfindertrading.com/leasing.html
The performance data on the website has been updated. Take a look at the Systems page and/or Portfolios page for more info. A summary of the comparison results is below (past performance is not necessarily indicative of future results):
5 YEAR HYPOTHETICAL RESULTS – May 1, 2007 to April 30, 2012
($50 roundtrip for commission & slippage included, see Disclosures)
| Original Systems | |||
| System | Net Profit | Max DD | Profit/DD |
| Cougar II | $ 58,430 | $ 5,010 | 11.7 |
| Jaguar II | $ 51,220 | $ 9,910 | 5.2 |
| Leopard II | $ 49,550 | $ 7,580 | 6.5 |
| Lion | $ 63,150 | $ 5,580 | 11.3 |
| Lion II | $ 62,800 | $ 6,740 | 9.3 |
| Tiger | $ 64,520 | $ 7,550 | 8.5 |
| Average | $ 58,278 | $ 7,062 | 8.8 |
| New Volatility Filtered Systems | |||
| System | Net Profit | Max DD | Profit/DD |
| Cougar Vol | $ 59,130 | $ 4,140 | 14.3 |
| Jaguar Vol | $ 54,410 | $ 3,550 | 15.3 |
| Leopard Vol | $ 55,330 | $ 4,150 | 13.3 |
| Lion Vol | $ 66,520 | $ 3,610 | 18.4 |
| Lion II Vol | $ 70,530 | $ 3,570 | 19.8 |
| Tiger Vol | $ 65,270 | $ 3,210 | 20.3 |
| Average | $ 61,865 | $ 3,705 | 16.9 |
| Original Portfolios | |||
| Portfolio | Net Profit | Max DD | Profit/DD |
| Index Trader I | $ 142,160 | $ 6,670 | 21.3 |
| Index Trader II | $ 268,650 | $ 8,870 | 30.3 |
| Index Trader III | $ 350,480 | $ 12,368 | 28.3 |
| Index Trader IV | $ 469,453 | $ 18,710 | 25.1 |
| Index Trader V | $ 574,073 | $ 27,743 | 20.7 |
| Wildcat I | $ 121,230 | $ 10,950 | 11.1 |
| Wildcat II | $ 170,780 | $ 18,530 | 9.2 |
| Wildcat III | $ 233,930 | $ 23,350 | 10.0 |
| Wildcat IV | $ 298,450 | $ 30,730 | 9.7 |
| Wildcat V | $ 349,670 | $ 40,640 | 8.6 |
| Average | $ 297,888 | $ 19,856 | 17.4 |
| New Portfolios | |||
| Portfolio | Net Profit | Max DD | Profit/DD |
| Index Trader I | $ 154,480 | $ 6,630 | 23.3 |
| Index Trader II | $ 272,270 | $ 9,040 | 30.1 |
| Index Trader III | $ 366,070 | $ 11,025 | 33.2 |
| Index Trader IV | $ 486,773 | $ 15,048 | 32.3 |
| Index Trader V | $ 593,513 | $ 19,090 | 31.1 |
| Wildcat I | $ 125,860 | $ 5,890 | 21.4 |
| Wildcat II | $ 180,270 | $ 7,030 | 25.6 |
| Wildcat III | $ 243,420 | $ 10,970 | 22.2 |
| Wildcat IV | $ 308,690 | $ 13,770 | 22.4 |
| Wildcat V | $ 367,820 | $ 14,460 | 25.4 |
| Average | $ 309,917 | $ 11,295 | 26.7 |
When I did testing for these new systems, I tested from January 1, 2004 up to as current as last Friday. In most cases the new systems did not have a higher net profit than the original systems. When running the past 5 year results for this blog, I was quite surprised to see the net profits be higher than the original systems for this time period (I kept checking to see if I had made a mistake somewhere). It was a nice surprise but don’t expect this to always be the case! I do expect future drawdowns for the new systems to be lower than the drawdowns of the current systems (and profit/drawdown ratios to be higher) but do not expect the net profit to necessarily be higher.
A note about curve-fitting/over-fitting. Some may look at these results and say “He just optimized for the best results and that is over-fitting. These new systems won’t do as well going forward”. If you had this thought good for you! That is good thinking and that kind of thinking should help you tremendously in your investments. I intentionally did not optimize for the best results. What I did was create 4 different volatility filters and apply them to every system. I never went back and changed any parameters – it was an out of sample test of these filters (with the exception of Jaguar Vol – I did do preliminary tests on Jaguar II when creating two of the filters). To provide diversification I didn’t want to use the same filter for every system. So, the one place where some curve-fitting comes into play is in picking the filter/combination to use for each system. For each system I either picked the filter that had the best result or used more than one filter to allow more trades and have a different filter than the other systems.
My first concern is that your accounts are growing, and I think these new systems will support that better than the current ones. If you have any questions please feel free to contact me!
Thanks,
gary
Changes coming…
It is clear from the results so far this year that most of the intraday systems are not performing within acceptable parameters. One clear indication of this is that many have exceeded 1.5 times their previous max historical drawdown. Your largest drawdown is always in the future, but you also have to stop trading at some point to protect capital. These systems could certainly recover – and that may happen soon given the amount of volatility that could be coming with problems in Europe and possibly China and elsewhere – however I think it’s time to stop trading most of them.
The intraday systems perform best in markets with high volatility and under-perform during low volatility. I have always left it up to the subscriber to choose when to turn systems off/on, but I now want include that within most of the systems themselves. These new systems only trade during markets that typically provide the best results. They use the VIX and/or the average daily range to determine the volatility of the market. Each system uses a different measure to provide diversification. I have almost finished the walk-forward analysis (to help confirm I am not over-fitting) and hope to have them ready to release within a week. Since they will be trading less frequently and could go months without a trade, I will be reducing the lease fees.
It reminds me of many trader’s (and mine) biggest hurdle you have to overcome – over-trading. When there is not a good trade opportunity you should just sit on your hands! These new systems use that philosophy. I have avoided taking this action for a while because I was afraid clients would get upset when they had periods where there were no trades (and broker’s aren’t crazy about it either), and I apologize for that. My first concern is that your accounts are growing, and I think these new systems will support that better than the current ones.
If you have any questions about this please feel free to contact me.
Trendfinder’s systems take top 3 spots in Futures Truth
The latest issue of Futures Truth (#1-2012) came out yesterday. Trendfinder’s systems took the top 3 rankings for all Day Trade systems and all Mini Russell systems. Lion, Lion II and Tiger were also ranked in their Top Ten Tables for all systems “since release date” and for “past 12 months”.
FedSwing – a new swing system
“Don’t fight the Fed” may be something you have heard at some point. It appears to be a good adage to follow. After observing the market’s behavior during QE1 and QE2 I started research into this (see this post). FedSwing is a result of that research.
FedSwing is a swing trading system that is counter-trend in nature and is used for stock indices. It will not go long when the Fed is selling and will not go short when the Fed is buying. It uses a stop-loss that is the smaller of a volatility based stop or money management stop ($3000 for stock index futures). It is being offered for trading the S&P MidCap 400 (EMD), S&P 500 (ES) and Russell 2000 (RL). It can be traded on the Dow (YM) and Nasdaq (NQ), but because of their low contract size they aren’t worth trading in my opinion even though they have profitable results on both (I’ve removed YM and NQ from MeanSwing II as well) .
FedSwing is uncorrelated to the MeanSwing II systems (5 year correlation ranges from -0.15 to 0.16) and has very low correlation with the intraday systems (5 year correlation ranges from -.07 to 0.41). This makes it a very nice fit in the Index Trader portfolios!
For 5 year performance information please go to the website pages for Systems or Portfolios.
To give you the most recent results, here is the performance for each FedSwing system and the updated Index Trader portfolios:
| Hypothetical Results – 1 contract per trade | |||||
| (commission and slippage included, see Info/Disclaimers in top menu) | |||||
| Month | Year | Past | |||
| System | to-date | to-date | 12 months | ||
| FedSwing EMD | $ 2,980 | $ 1,140 | $ 28,600 | ||
| FedSwing ES | $ 1,348 | $ (453) | $ 13,520 | ||
| FedSwing RL | $ 3,600 | $ 7,010 | $ 29,510 | ||
| Month | Year | Past | |||
| Portfolio | to-date | to-date | 12 months | ||
| Index Trader I | $ 4,610 | $ 5,790 | $ 40,340 | ||
| Index Trader II | $ 7,040 | $ 2,860 | $ 62,130 | ||
| Index Trader III | $ 7,170 | $ 493 | $ 61,235 | ||
| Index Trader IV | $ 8,418 | $ (810) | $ 81,085 | ||
| Index Trader V | $ 8,598 | $ (6,620) | $ 83,755 | ||
Trendfinder’s systems take top 4 spots in Futures Truth
The latest issue of Futures Truth (#4-2011) came out today. Trendfinder’s systems took the top 4 rankings for all Day Trade systems and all Mini Russell systems. Lion II and Tiger were also ranked highly in their Top Ten Tables for all systems.
