Daily Results for 9/14/11
The Bobcat systems made big profits going long today.
| Daily Hypothetical Results – 1 contract per trade | |||||
| (commission and slippage included, see Info/Disclaimers in top menu) | |||||
| System | # Trades | Net Profit | |||
| Bobcat I | 1 | $ 1,180 | |||
| Bobcat II | 1 | $ 1,180 | |||
| Cougar | – | – | |||
| Cougar Alt | – | – | |||
| Jaguar | – | – | |||
| Jaguar Alt | – | – | |||
| Leopard | – | – | |||
| Leopard Alt | – | – | |||
| Lion | – | – | |||
| Lion II | – | – | |||
| Lion II Alt | – | – | |||
| Tiger | – | – | |||
| MeanSwing II EMD | – | – | |||
| MeanSwing II ES | – | – | |||
| MeanSwing II NQ | – | – | |||
| MeanSwing II RL | – | – | |||
| MeanSwing II YM | – | – | |||
| Portfolio | # Trades | Net Profit | |||
| Index Trader I | 0 | $ – | |||
| Index Trader II | 0 | $ – | |||
| Index Trader III | 0 | $ – | |||
| Index Trader IV | 0 | $ – | |||
| Index Trader V | 0 | $ – | |||
| Wildcat I | 0 | $ – | |||
| Wildcat II | 0 | $ – | |||
| Wildcat III | 1 | $ 1,180 | |||
| Wildcat IV | 1 | $ 1,180 | |||
| Wildcat V | 1 | $ 1,180 | |||
| For more information about these systems, please go to | |||||
| www.trendfindertrading.com | |||||
Daily Results for 9/13/11
Almost every intraday system traded long today. All but one ended with a profit (Tiger was stopped out during a sharp pullback).
| Daily Hypothetical Results – 1 contract per trade | |||||
| (commission and slippage included, see Info/Disclaimers in top menu) | |||||
| System | # Trades | Net Profit | |||
| Bobcat I | – | – | |||
| Bobcat II | – | – | |||
| Cougar | 1 | $ 140 | |||
| Cougar Alt | 1 | $ 190 | |||
| Jaguar | 1 | $ 440 | |||
| Jaguar Alt | 1 | $ 400 | |||
| Leopard | 1 | $ 330 | |||
| Leopard Alt | 1 | $ 250 | |||
| Lion | 1 | $ 320 | |||
| Lion II | 1 | $ 320 | |||
| Lion II Alt | 1 | $ 400 | |||
| Tiger | 1 | $ (650) | |||
| MeanSwing II EMD | – | – | |||
| MeanSwing II ES | – | – | |||
| MeanSwing II NQ | – | – | |||
| MeanSwing II RL | – | – | |||
| MeanSwing II YM | – | – | |||
| Portfolio | # Trades | Net Profit | |||
| Index Trader I | 1 | $ 400 | |||
| Index Trader II | 2 | $ 800 | |||
| Index Trader III | 3 | $ 1,130 | |||
| Index Trader IV | 4 | $ 1,320 | |||
| Index Trader V | 5 | $ 670 | |||
| Wildcat I | 2 | $ 760 | |||
| Wildcat II | 3 | $ 900 | |||
| Wildcat III | 3 | $ 900 | |||
| Wildcat IV | 4 | $ 250 | |||
| Wildcat V | 5 | $ 580 | |||
| For more information about these systems, please go to | |||||
| www.trendfindertrading.com | |||||
Weekly Results – week ending 9/9/11
It was a slow trading week. Of the 7 systems that traded, 5 had gains, 1 was break-even and 1 had a loss.
If you didn’t see my post about the effects of POMO activity during QE1 and QE2 please click here. I think it is a pretty valuable study.
| Weekly Hypothetical Results – 1 contract per trade | |||||
| (commission and slippage included, see Info/Disclaimers in top menu) | |||||
| Weekly | Month | Year | |||
| System | # Trades | Net Profit | to-date | to-date | |
| Bobcat I | 2 | $ 250 | $ (160) | $ 1,380 | |
| Bobcat II | – | – | $ (410) | $ 1,530 | |
| Cougar | 1 | $ 830 | $ 830 | $ 2,880 | |
| Cougar Alt | 1 | $ 820 | $ 820 | $ 1,240 | |
| Jaguar | – | – | $ – | $ (5,740) | |
| Jaguar Alt | – | – | $ – | $ (4,400) | |
| Leopard | – | – | $ – | $ 470 | |
| Leopard Alt | – | – | $ – | $ (2,520) | |
| Lion | 4 | $ 60 | $ 1,400 | $ 2,330 | |
| Lion II | 2 | $ – | $ 1,340 | $ 1,690 | |
| Lion II Alt | 2 | $ (820) | $ 720 | $ 1,650 | |
| Tiger | 1 | $ 1,080 | $ 1,970 | $ 5,830 | |
| MeanSwing II EMD | – | – | $ 3,470 | $ 6,940 | |
| MeanSwing II ES | – | – | $ 1,855 | $ 817 | |
| MeanSwing II NQ | – | – | $ 1,065 | $ (920) | |
| MeanSwing II RL | – | – | $ 1,690 | $ 2,295 | |
| MeanSwing II YM | – | – | $ 1,520 | $ 1,590 | |
| Weekly | Month | Year | |||
| Portfolio | # Trades | Net Profit | to-date | to-date | |
| Index Trader I | 0 | $ – | $ 1,855 | $ (3,583) | |
| Index Trader II | 2 | $ (820) | $ 4,265 | $ 362 | |
| Index Trader III | 2 | $ (820) | $ 7,735 | $ 7,772 | |
| Index Trader IV | 3 | $ – | $ 10,075 | $ 10,602 | |
| Index Trader V | 4 | $ 1,080 | $ 13,110 | $ 15,512 | |
| Wildcat I | 2 | $ – | $ 1,340 | $ (4,050) | |
| Wildcat II | 3 | $ 830 | $ 2,170 | $ (1,170) | |
| Wildcat III | 3 | $ 830 | $ 1,760 | $ 360 | |
| Wildcat IV | 4 | $ 1,910 | $ 3,730 | $ 6,190 | |
| Wildcat V | 4 | $ 1,910 | $ 3,730 | $ 6,660 | |
| For more information about these systems, please go to | |||||
| www.trendfindertrading.com | |||||
Daily Results for 9/8/11
Mixed results today. First Bobcat I and Lion took a stab to the long side and were both stopped out. Later many systems went short with all but one having profitable trades (Lion II Alt was stopped out).
| Daily Hypothetical Results – 1 contract per trade | |||||
| (commission and slippage included, see Info/Disclaimers in top menu) | |||||
| System | # Trades | Net Profit | |||
| Bobcat I | 1 | $ (410) | |||
| Bobcat II | – | – | |||
| Cougar | 1 | $ 830 | |||
| Cougar Alt | 1 | $ 820 | |||
| Jaguar | – | – | |||
| Jaguar Alt | – | – | |||
| Leopard | – | – | |||
| Leopard Alt | – | – | |||
| Lion | 2 | $ (450) | |||
| Lion II | 1 | $ 210 | |||
| Lion II Alt | 1 | $ (650) | |||
| Tiger | 1 | $ 1,080 | |||
| MeanSwing II EMD | – | – | |||
| MeanSwing II ES | – | – | |||
| MeanSwing II NQ | – | – | |||
| MeanSwing II RL | – | – | |||
| MeanSwing II YM | – | – | |||
| Portfolio | # Trades | Net Profit | |||
| Index Trader I | 0 | $ – | |||
| Index Trader II | 1 | $ (650) | |||
| Index Trader III | 1 | $ (650) | |||
| Index Trader IV | 2 | $ 170 | |||
| Index Trader V | 3 | $ 1,250 | |||
| Wildcat I | 1 | $ 210 | |||
| Wildcat II | 2 | $ 1,040 | |||
| Wildcat III | 2 | $ 1,040 | |||
| Wildcat IV | 3 | $ 2,120 | |||
| Wildcat V | 3 | $ 2,120 | |||
| For more information about these systems, please go to | |||||
| www.trendfindertrading.com | |||||
POMO, QE1, QE2 impact on trading results
I have wondered if the reason the intraday systems performed poorly the first half of this year is because the market behavior was different because of QE2. With the large amount of Fed buying securities the market was no longer moving freely – it was artificially impacted by the Fed buying. So I took a look into this. This is not a scientific study but I do believe it provides some valuable insight into whether Trendfinder’s intraday systems are still performing as expected or are “broken”. I noticed that since QE2 ended 6/30/11 that the markets seem to be moving freely again. I don’t know how to explain this other that it seems price is able to go where it is supposed to. This is purely my observation and I have no objective evidence. I did this study to look at actual evidence, not just my senses.
My idea for how to research this came from posts about POMO activity in a great blog called Quantifiable Edges. POMO stands for Permanent Open Market Operations. This is how the Fed buys or sells securities. From the Fed’s website, POMO is “Purchases or sales of securities on an outright basis that add or drain reserves and change the size of the System Open Market Account (SOMA) portfolio are amongst the tools used by the Federal Reserve to implement monetary policy.” For more info go here: http://www.newyorkfed.org/markets/pomo_landing.html
To look at the impact POMO buying had during QE1 and QE2 I first looked at the chart in this Quantifiable Edges blog post. In that chart you can clearly see the POMO buying areas during QE1 and QE2. I then looked at the Fed’s POMO database to determine the exact dates to use for the start/stop dates of POMO buying. I determined these by seeing pretty clear demarcations of when buying increased/decreased substantially. For QE1 the start date for POMO buying I am using is 3/25/09 and end date is 10/29/09. For QE2 I am using a start date of 11/15/10 and end date of 6/30/11.
The first set of charts are equity curves using results from implementing revisions to systems in a walk-forward fashion. This way the results match what was being traded at the time.
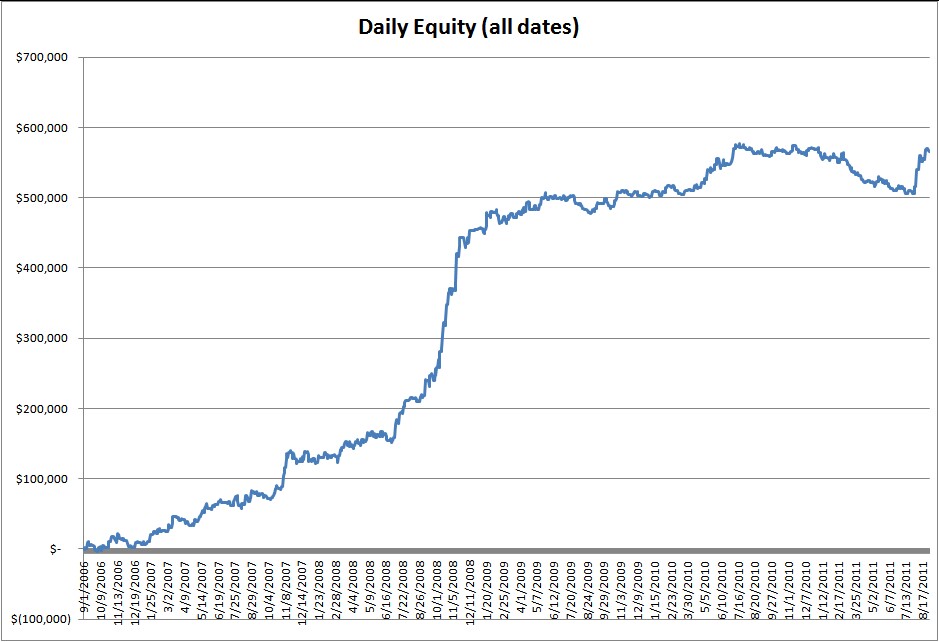
First, here is the equity curve for the entire period:
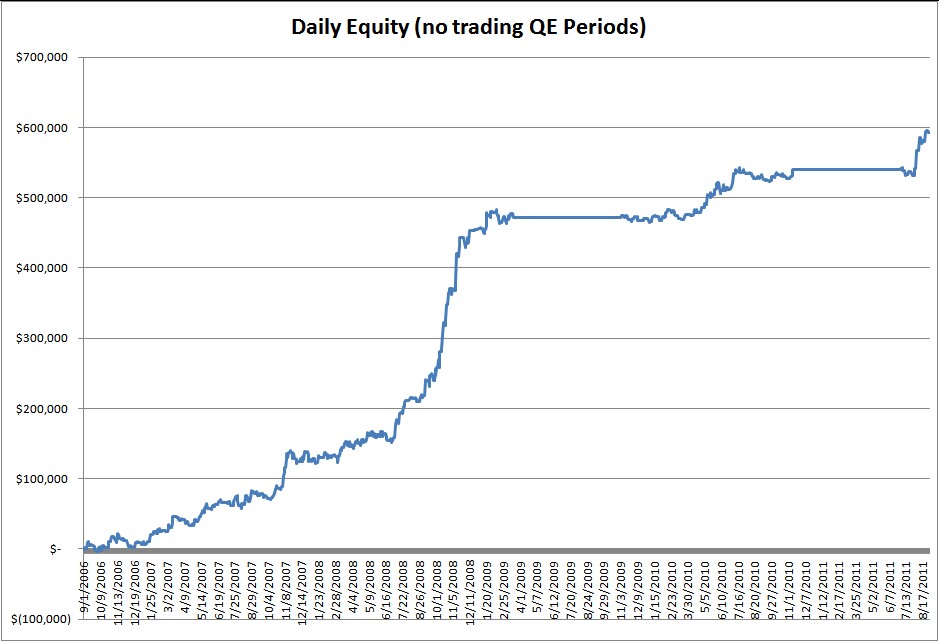
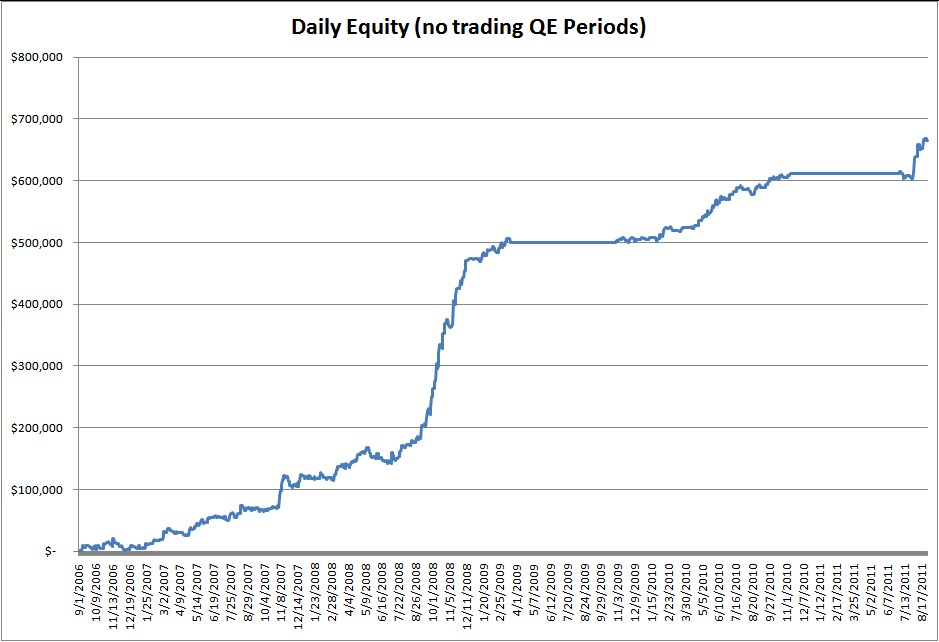
Next, here is the equity curve with no trading during QE1 and QE2 POMO buying:
And finally, the consolidated equity curve with the QE1 and QE2 POMO buying periods removed:
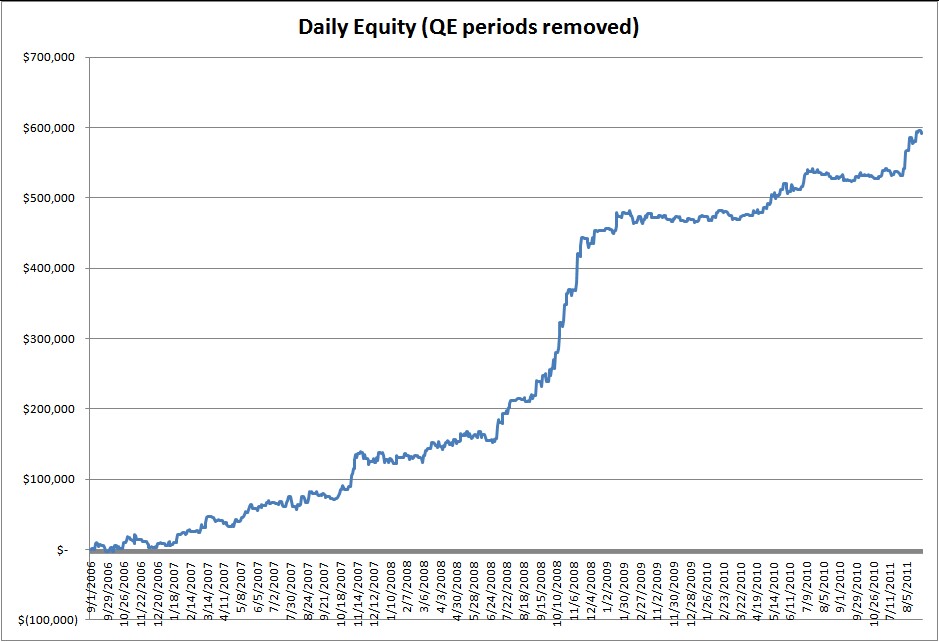
As you can see, the results during QE1 and QE2 POMO buying were much choppier. The end result (equity) is a little higher ($25,990 which is a 4.5% increase), but by not trading during the QE1 and QE2 POMO buying periods, the drawdowns were much less. So, are the systems broken? I say no. However they will probably underperform during periods of major Fed intervention.
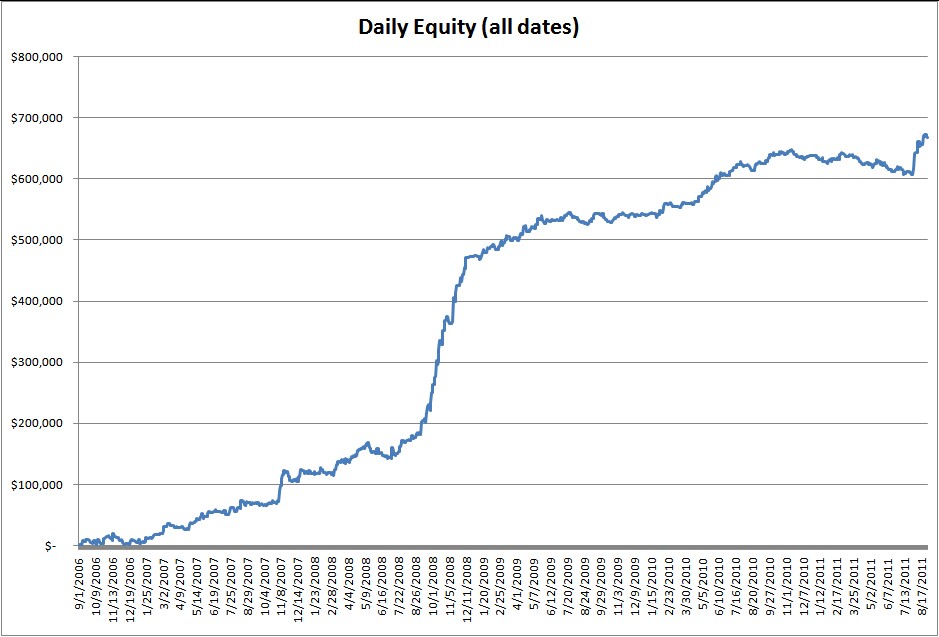
Now, as a comparison I looked at just using the current version of each system for the entire period.
Equity curve for the entire period:
Equity curve with no trading during QE1 and QE2 POMO buying:
And the consolidated equity curve with the QE1 and QE2 POMO buying periods removed:
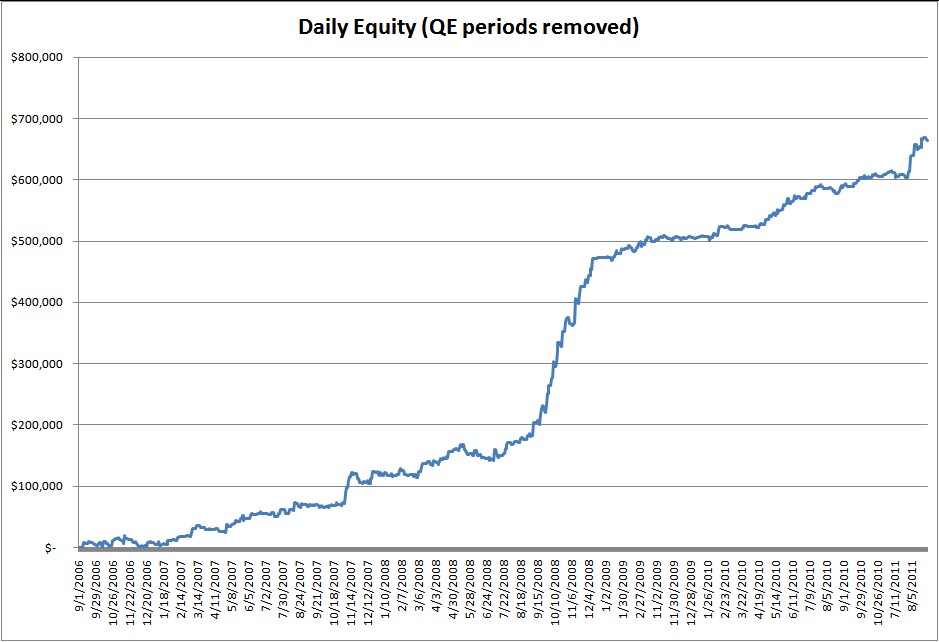
The results were similar, and the equity curves look even better in my opinion.
CONCLUSION: My opinion is that the systems are performing as expected during typical markets, and will probably underperform during manipulated markets (extremely large Fed POMO buying).
Daily Results for 9/6/11
Four systems traded today. Lion II and Lion II Alt went short this morning and exited with small losses. Lion first went short then reversed long and more than made up for the first loss. Bobcat I went long and profited.
| Daily Hypothetical Results – 1 contract per trade | |||||
| (commission and slippage included, see Info/Disclaimers in top menu) | |||||
| System | # Trades | Net Profit | |||
| Bobcat I | 1 | $ 660 | |||
| Bobcat II | – | – | |||
| Cougar | – | – | |||
| Cougar Alt | – | – | |||
| Jaguar | – | – | |||
| Jaguar Alt | – | – | |||
| Leopard | – | – | |||
| Leopard Alt | – | – | |||
| Lion | 2 | $ 510 | |||
| Lion II | 1 | $ (210) | |||
| Lion II Alt | 1 | $ (170) | |||
| Tiger | – | – | |||
| MeanSwing II EMD | – | – | |||
| MeanSwing II ES | – | – | |||
| MeanSwing II NQ | – | – | |||
| MeanSwing II RL | – | – | |||
| MeanSwing II YM | – | – | |||
| Portfolio | # Trades | Net Profit | |||
| Index Trader I | 0 | $ – | |||
| Index Trader II | 1 | $ (170) | |||
| Index Trader III | 1 | $ (170) | |||
| Index Trader IV | 1 | $ (170) | |||
| Index Trader V | 1 | $ (170) | |||
| Wildcat I | 1 | $ (210) | |||
| Wildcat II | 1 | $ (210) | |||
| Wildcat III | 1 | $ (210) | |||
| Wildcat IV | 1 | $ (210) | |||
| Wildcat V | 1 | $ (210) | |||
| For more information about these systems, please go to | |||||
| www.trendfindertrading.com | |||||
Weekly Results – week ending 9/2/11
Variety of results this week. 9 systems had gains, 6 had losses and 2 had no trades. Overall a profitable week.
| Weekly Hypothetical Results – 1 contract per trade | |||||
| (commission and slippage included, see Info/Disclaimers in top menu) | |||||
| Weekly | Month | Year | |||
| System | # Trades | Net Profit | to-date | to-date | |
| Bobcat I | 2 | $ (820) | $ (410) | $ 1,130 | |
| Bobcat II | 1 | $ (410) | $ (410) | $ 1,530 | |
| Cougar | – | – | $ – | $ 2,050 | |
| Cougar Alt | – | – | $ – | $ 420 | |
| Jaguar | 3 | $ (1,490) | $ – | $ (5,740) | |
| Jaguar Alt | 2 | $ (770) | $ – | $ (4,400) | |
| Leopard | 2 | $ (760) | $ – | $ 470 | |
| Leopard Alt | 2 | $ (450) | $ – | $ (2,520) | |
| Lion | 2 | $ 1,290 | $ 1,340 | $ 2,270 | |
| Lion II | 1 | $ 1,340 | $ 1,340 | $ 1,690 | |
| Lion II Alt | 1 | $ 1,540 | $ 1,540 | $ 2,470 | |
| Tiger | 1 | $ 890 | $ 890 | $ 4,750 | |
| MeanSwing II EMD | 1 | $ 3,470 | $ 3,470 | $ 6,940 | |
| MeanSwing II ES | 1 | $ 1,855 | $ 1,855 | $ 817 | |
| MeanSwing II NQ | 1 | $ 1,065 | $ 1,065 | $ (920) | |
| MeanSwing II RL | 1 | $ 1,690 | $ 1,690 | $ 2,295 | |
| MeanSwing II YM | 1 | $ 1,520 | $ 1,520 | $ 1,590 | |
| Weekly | Month | Year | |||
| Portfolio | # Trades | Net Profit | to-date | to-date | |
| Index Trader I | 3 | $ 1,085 | $ 1,855 | $ (3,583) | |
| Index Trader II | 4 | $ 4,315 | $ 5,085 | $ 1,182 | |
| Index Trader III | 7 | $ 7,025 | $ 8,555 | $ 8,592 | |
| Index Trader IV | 7 | $ 8,545 | $ 10,075 | $ 10,602 | |
| Index Trader V | 8 | $ 10,500 | $ 12,030 | $ 14,432 | |
| Wildcat I | 4 | $ (150) | $ 1,340 | $ (4,050) | |
| Wildcat II | 4 | $ (150) | $ 1,340 | $ (2,000) | |
| Wildcat III | 5 | $ (560) | $ 930 | $ (470) | |
| Wildcat IV | 6 | $ 330 | $ 1,820 | $ 4,280 | |
| Wildcat V | 8 | $ (430) | $ 1,820 | $ 4,750 | |
| For more information about these systems, please go to | |||||
| www.trendfindertrading.com | |||||