Systems simplified and new versions released
After my Mea Culpa post, I looked deeper into the structure of each intraday system and whether it made sense to maintain the prior updates or revert back to the original code. Since my goal is to provide systems that trade well with real money going forward, it makes sense to me that the systems be as simple as possible to increase the likelihood of future results matching the historical results. For that reason I removed almost all previous updates and simplified the systems. In some cases I released a new version for clarity. I have restructured the intraday systems as follows:
Bobcat I & Bobcat II – retired (insufficient profit to justify continued trading).
Cougar & Cougar Alt – replaced with Cougar II and Cougar II Alt. The new version has the March 21, 2011 update removed and the November 1, 2010 retained. It was released as a new version since there was an update retained.
Jaguar & Jaguar Alt – replaced with Jaguar II and Jaguar II Alt. The new version has all updates removed, filtering simplified, and it no longer reverses (to reduce the chances of a large one day loss).
Leopard & Leopard Alt – replaced with Leopard II and Leopard II Alt. The new version has the March 21, 2011 update removed and trades limited to 1 per day (to eliminate a large one day loss).
Lion – no change.
Lion II & Lion II Alt – removed the March 21, 2011 update. It is now the original strategy again so retained the names.
Tiger – removed the March 21, 2011 update. It is now the original strategy again so retained the name.
The website has been updated to reflect these changes (when you go there you may have to refresh to see the updates). Please take a look at the Systems and Portfolios pages for links to performance reports and graphs. The full reports are now downloadable in a zip file – those of you who were not able to view the reports before should be able to now. The zip file can be downloaded and opened via any browser, but the actual report (.mht) in the file must be opened with Internet Explorer or IE tab.
These changes take effect Tuesday January 17, 2012. Clients may continue trading the retired and/or replaced systems if they wish.
Mea Culpa – comparing results with/without updates
I made an update to every system effective March 21, 2011. The table below shows the results for each system for trades from 3/21/11 to 12/31/11. As usual, $50 per roundtrip trade is included for commissions and slippage.
COMPARISON RESULTS FROM 3/21/11-12/31/11
| System | Current/Updated | Without Update | Difference |
| Bobcat I | -1660 | -1370 | -290 |
| Bobcat II | 1170 | 1460 | -290 |
| Cougar | 6620 | 7090 | -470 |
| Cougar Alt | 2490 | 5440 | -2950 |
| Jaguar | -1530 | 3440 | -4970 |
| Jaguar Alt | -850 | 4050 | -4900 |
| Leopard | 3970 | 9950 | -5980 |
| Leopard Alt | 3630 | 5830 | -2200 |
| Lion | 7150 | 11600 | -4450 |
| Lion II | 6710 | 13990 | -7280 |
| Lion II Alt | 6220 | 13040 | -6820 |
| Tiger | 8510 | 12510 | -4000 |
| Total Net Profit | $42,430 | $87,030 | -$44,600 |
| Total Max Drawdown | -$31,500 | -$29,580 | $1,920 |
As you can see above, the updates did not help the results at all! Every system would have had better results if the updates had not been applied. In total, the profit since 3/21/11 was half of what the profit would have been without the updates. The total max drawdown was about the same, with a slight increase due to the updates.
Wow, what a mea culpa moment! Granted, 9+ months isn’t a real long time, but looking at these numbers it appears I overfit these systems with the 3/21 update. Here are lessons learned again – 1) simpler is better and 2) don’t panic during a drawdown. I am going to research this deeper and probably revert these systems back to what they were before the 3/21 update.
MeanSwing II code error fixed
I discovered a minor coding error in MeanSwing II that was causing a few short trades to not execute (I forgot a minus sign in one line). I have corrected the performance results on the website and blog. One short trade in the EMD was added to 11/9/11, and short trades in the EMD, ES and RL were added to 12/8/11. I am sending the updated code to all brokers now so no future trades are missed.
Looking Forward not Backward
When you are driving down the road do you only look in the rear-view mirror or do you look at the road in front of you?
When you are making investment decisions do you make them based on what you expect in the future or what has happened in the past?
When you are choosing a trading system/methodology do you look at past results only or base your choice on what is likely to happen in the future?
Based on conversations I have had recently with brokers, clients and potential clients, the tendency seems to be looking at what has happened in the past NOT what is likely to happen in the future.
If you don’t drive by looking backwards, then why make investment choices by looking backwards?
I think I know why. Because it is MUCH easier to look backward (past) than it is to look forward (future). Also, you are never wrong when you look backward but are often wrong when looking forward. So why bother even looking forward if you are probably wrong! I think that mentality has to be overcome for successful investing. I know I have had to deal with this…it is very easy for a system developer to only look backward since that is the data we have to test on. However, I think trading and investment system success only happens when one develops the ability to base decisions on the probable future instead of the certain past. Let me repeat that, I assert that trading system and investment success only happens when one develops the ability to base decisions on the probable future instead of the certain past.
Now, how do we determine the probable future? Well, unless you can see the future (I can’t), the best you can do is look at what is happening right now. To continue with the driving analogy, we can look at our speed, weather conditions, number of cars on the road, lanes of traffic, etc. to determine our probable future (will we get where we want on time, is someone going to pull out in front of us, etc.). For trading, are the strategies performing as expected, what is current volatility and 3 month implied volatility and is that good/bad typically for this system, is there any outside influence on the market (i.e. FED POMO buying/selling), etc.
System trading is not easy. And trading systems after you have had big losses is even tougher. Specifically with my systems, by far the most common thought is that these systems don’t work anymore because of the results the first half of the year. Well, ALL systems have drawdowns and now these systems have come out of one of their biggest ones, and I assert the reason for the big drawdown is because the market behavior changes when the FED is pumping in money like it did during QE1 and QE2 (ref. blog post: http://trendfindertrading.com/blog/?p=1920). Now that the intervention is over, these systems are back to performing as expected. Also, current volatility and 3 month implied volatility are high, which is when these systems typically make their largest profits. Is it certain Trendfinder’s systems will have large profits the next few months? Of course not, but based on current conditions that is the likely future in my opinion.
Take on looking forward not backward.
POMO, QE1, QE2 impact on trading results
I have wondered if the reason the intraday systems performed poorly the first half of this year is because the market behavior was different because of QE2. With the large amount of Fed buying securities the market was no longer moving freely – it was artificially impacted by the Fed buying. So I took a look into this. This is not a scientific study but I do believe it provides some valuable insight into whether Trendfinder’s intraday systems are still performing as expected or are “broken”. I noticed that since QE2 ended 6/30/11 that the markets seem to be moving freely again. I don’t know how to explain this other that it seems price is able to go where it is supposed to. This is purely my observation and I have no objective evidence. I did this study to look at actual evidence, not just my senses.
My idea for how to research this came from posts about POMO activity in a great blog called Quantifiable Edges. POMO stands for Permanent Open Market Operations. This is how the Fed buys or sells securities. From the Fed’s website, POMO is “Purchases or sales of securities on an outright basis that add or drain reserves and change the size of the System Open Market Account (SOMA) portfolio are amongst the tools used by the Federal Reserve to implement monetary policy.” For more info go here: http://www.newyorkfed.org/markets/pomo_landing.html
To look at the impact POMO buying had during QE1 and QE2 I first looked at the chart in this Quantifiable Edges blog post. In that chart you can clearly see the POMO buying areas during QE1 and QE2. I then looked at the Fed’s POMO database to determine the exact dates to use for the start/stop dates of POMO buying. I determined these by seeing pretty clear demarcations of when buying increased/decreased substantially. For QE1 the start date for POMO buying I am using is 3/25/09 and end date is 10/29/09. For QE2 I am using a start date of 11/15/10 and end date of 6/30/11.
The first set of charts are equity curves using results from implementing revisions to systems in a walk-forward fashion. This way the results match what was being traded at the time.
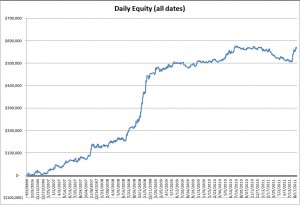
First, here is the equity curve for the entire period:
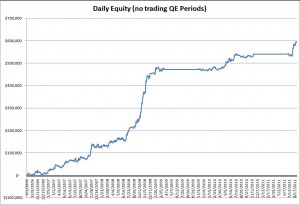
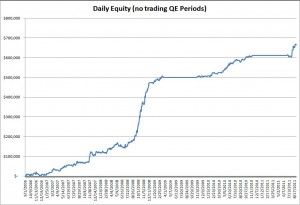
Next, here is the equity curve with no trading during QE1 and QE2 POMO buying:
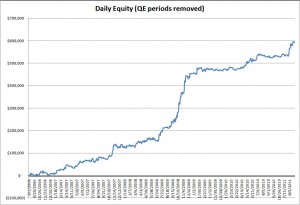
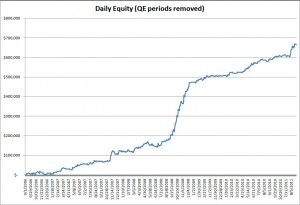
And finally, the consolidated equity curve with the QE1 and QE2 POMO buying periods removed:
As you can see, the results during QE1 and QE2 POMO buying were much choppier. The end result (equity) is a little higher ($25,990 which is a 4.5% increase), but by not trading during the QE1 and QE2 POMO buying periods, the drawdowns were much less. So, are the systems broken? I say no. However they will probably underperform during periods of major Fed intervention.
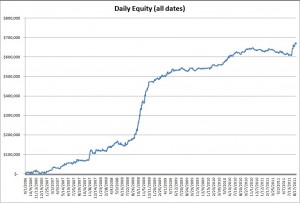
Now, as a comparison I looked at just using the current version of each system for the entire period.
Equity curve for the entire period:
Equity curve with no trading during QE1 and QE2 POMO buying:
And the consolidated equity curve with the QE1 and QE2 POMO buying periods removed:
The results were similar, and the equity curves look even better in my opinion.
CONCLUSION: My opinion is that the systems are performing as expected during typical markets, and will probably underperform during manipulated markets (extremely large Fed POMO buying).
MeanSwing II released & Index Trader Portfolios revised
MeanSwing II has been released. It is the same strategy as MeanSwing with one alteration – an additional $5000 trailing stop has been added for better risk management control. The existing volatility based trailing stop is still being used as well – the system will use whichever trailing stop is closer to price.
I revised the Index Trader Portfolios which combine the swing and intraday systems. Each portfolio now has an equal number of swing and intraday systems in them. I think these portfolios now provide a robust combination of systems to handle any market environment. Click here to see the performance reports. I also updated the portfolio lease pricing as well.
Drawdown over for every intraday portfolio
I updated the website with performance results through yesterday August 15th. Every Wildcat Portfolio (intraday systems) recently reached new equity highs. This ends a very long and deep drawdown for the intraday portfolios.
I have revised the MeanSwing systems to include a fixed dollar money management trailing stop. I am in the process of updating the website with the new performance reports. I will provide a new blog post when the website is up to date. As a teaser – I was very pleasantly surprised to see how well the new Index Trader Portfolios perform with the revised MeanSwing system and portfolio changes.
May be good time to start intraday systems
For those of you standing aside, my opinion is that the next few months should have good results for the intraday systems. This is because of the high volatility in the market, where these systems typically thrive. So, if you are waiting for a time to start trading again, my opinion is that the time is now. I do not recommend waiting until there are 2-3 months of good results – this will result, again per my opinion, in missing the best time to trade, and have you starting at a less than optimum time.
Tiger & Lion II rankings in Futures Truth
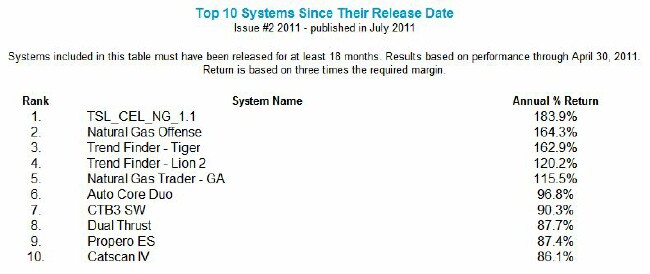
In the latest issue of Futures Truth (published July 2011), Tiger and Lion II were ranked #3 and #4 in their “Top Ten Systems Since Release Date”. They were the highest ranked systems that trade stock index futures.
New swing systems and portfolios
The MeanSwing strategy is now officially released. There are two systems: MeanSwing ES NQ applies the MeanSwing strategy to the emini futures of the S&P 500 and Nasdaq 100, and MeanSwing Indices applies the MeanSwing strategy to all five US emini stock index futures (S&P 500, Nasdaq 100, Dow Industrials, Russell 2000 and S&P MidCap 400). There are four portfolios that include these new systems as well – click here and scroll down to the “Index Trader” portfolios.
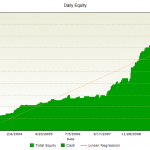
This swing strategy is the result of my looking to create a system that performs well when the intraday trend-following strategies are performing poorly. The result is a mean-reversion (counter trend) swing system that has performed well not only when the intraday trend-following strategies are performing poorly (so far in 2011 MeanSwing has a gain in every index) but also for the entire history of each index future. Here are the equity curves for the entire history of each emini index future (see Disclaimers link in top menu, past performance is not necessarily indicative of future results). The final equity curve is all indices combined.
And how does MeanSwing do when combined with the intraday strategies? Pretty well in my opinion. There is low correlation which provides the desired diversification. In fact the drawdown for the portfolios with MeanSwing Indices (Index Trader III and IV) have a lower historical max drawdown than the system alone since they are combined with intraday strategies. Please take a look at the Portfolios page for more information.
