Daily Results for 10/13/14
MeanSwing II was stopped out of a long trade in the TF (Russell 2000).
Due to increased volatility, several intraday systems are active again. Anticipate much more day trading in this environment.
|
|||||||
| (commission and slippage included, see Disclosures in top menu) | |||||||
| Swing Systems | # Trades | Net Profit | |||||
| FedSwing EMD | – | – | |||||
| FedSwing EMD-A | – | – | |||||
| FedSwing EMD-B | – | – | |||||
| FedSwing ES | – | – | |||||
| FedSwing TF | – | – | |||||
| FedSwing TF-A | – | – | |||||
| FedSwing TF-B | – | – | |||||
| FedSwing YM | – | – | |||||
| MeanSwing II EMD | – | – | |||||
| MeanSwing II EMD-A | – | – | |||||
| MeanSwing II EMD-B | – | – | |||||
| MeanSwing II ES | – | – | |||||
| MeanSwing II TF | 1 | $(2,850) | |||||
| Portfolios | # Trades | Net Profit | |||||
| Index Trader I | 0 | $- | |||||
| Index Trader II | 0 | $- | |||||
| Index Trader III | 0 | $- | |||||
| Index Trader IV | 0 | $- | |||||
| Index Trader V | 0 | $- | |||||
| Index Trader I-A | 0 | $- | |||||
| Index Trader II-A | 0 | $- | |||||
| Index Trader III-A | 0 | $- | |||||
| Index Trader IV-A | 0 | $- | |||||
| Index Trader V-A | 0 | $- | |||||
| Index Trader I-B | 0 | $- | |||||
| Index Trader II-B | 0 | $- | |||||
| Index Trader III-B | 0 | $- | |||||
| Index Trader IV-B | 0 | $- | |||||
| Index Trader V-B | 0 | $- | |||||
| For more information go to | |||||||
| www.trendfindertrading.com | |||||||
Weekly Results – week ending 10/10/14
FedSwing had one losing trade. Two intraday systems had winning trades this providing a profit for all the Index Trader Portfolios.
| Weekly Hypothetical Results (trades that exited this week) | |||
| (commission and slippage included, see Disclosures in top menu) | |||
| Swing Systems | # Trades | Net Profit | Month-to-date |
| FedSwing EMD | – | – | $(3,040) |
| FedSwing EMD-A | – | – | $(3,040) |
| FedSwing EMD-B | – | – | $(3,040) |
| FedSwing ES | – | – | $(2,208) |
| FedSwing TF | – | – | $(3,040) |
| FedSwing TF-A | – | – | $(3,040) |
| FedSwing TF-B | – | – | $(3,040) |
| FedSwing YM | 1 | $(2,060) | $(2,060) |
| MeanSwing II EMD | – | – | $(4,190) |
| MeanSwing II EMD-A | – | – | $(4,160) |
| MeanSwing II EMD-B | – | – | $(4,200) |
| MeanSwing II ES | – | – | $43 |
| MeanSwing II TF | – | – | $280 |
| Portfolios | # Trades | Net Profit | Month-to-date |
| Index Trader I | 2 | $1,670 | $(1,170) |
| Index Trader II | 2 | $1,670 | $(5,360) |
| Index Trader III | 3 | $2,720 | $(6,518) |
| Index Trader IV | 3 | $2,720 | $(6,475) |
| Index Trader V | 3 | $2,720 | $(9,515) |
| Index Trader I-A | 2 | $1,470 | $(1,620) |
| Index Trader II-A | 2 | $1,470 | $(5,780) |
| Index Trader III-A | 3 | $2,480 | $(6,858) |
| Index Trader IV-A | 3 | $2,480 | $(6,815) |
| Index Trader V-A | 3 | $2,480 | $(9,855) |
| Index Trader I-B | 2 | $1,660 | $(1,500) |
| Index Trader II-B | 2 | $1,660 | $(5,700) |
| Index Trader III-B | 3 | $2,650 | $(6,918) |
| Index Trader IV-B | 3 | $2,650 | $(6,875) |
| Index Trader V-B | 3 | $2,650 | $(9,915) |
| Index Swing 2 | 0 | $- | $(6,398) |
| Index Swing 3 | 0 | $- | $(9,438) |
| Index Swing 4 | 0 | $- | $(9,395) |
| Index Swing 5 | 0 | $- | $(12,435) |
| Index Swing 6 | 1 | $(2,060) | $(14,495) |
| Index Swing 2-A | 0 | $- | $(6,368) |
| Index Swing 3-A | 0 | $- | $(9,408) |
| Index Swing 4-A | 0 | $- | $(9,365) |
| Index Swing 5-A | 0 | $- | $(12,405) |
| Index Swing 6-A | 1 | $(2,060) | $(14,465) |
| For more information go to | |||
| www.trendfindertrading.com | |||
Daily Results for 10/10/14
FedSwing exited a long trade in the Dow (YM) for a loss.
|
|||||||
| (commission and slippage included, see Disclosures in top menu) | |||||||
| Swing Systems | # Trades | Net Profit | |||||
| FedSwing EMD | – | – | |||||
| FedSwing EMD-A | – | – | |||||
| FedSwing EMD-B | – | – | |||||
| FedSwing ES | – | – | |||||
| FedSwing TF | – | – | |||||
| FedSwing TF-A | – | – | |||||
| FedSwing TF-B | – | – | |||||
| FedSwing YM | 1 | $(2,060) | |||||
| MeanSwing II EMD | – | – | |||||
| MeanSwing II EMD-A | – | – | |||||
| MeanSwing II EMD-B | – | – | |||||
| MeanSwing II ES | – | – | |||||
| MeanSwing II TF | – | – | |||||
| Portfolios | # Trades | Net Profit | |||||
| Index Trader I | 0 | $- | |||||
| Index Trader II | 0 | $- | |||||
| Index Trader III | 0 | $- | |||||
| Index Trader IV | 0 | $- | |||||
| Index Trader V | 0 | $- | |||||
| Index Trader I-A | 0 | $- | |||||
| Index Trader II-A | 0 | $- | |||||
| Index Trader III-A | 0 | $- | |||||
| Index Trader IV-A | 0 | $- | |||||
| Index Trader V-A | 0 | $- | |||||
| Index Trader I-B | 0 | $- | |||||
| Index Trader II-B | 0 | $- | |||||
| Index Trader III-B | 0 | $- | |||||
| Index Trader IV-B | 0 | $- | |||||
| Index Trader V-B | 0 | $- | |||||
| For more information go to | |||||||
| www.trendfindertrading.com | |||||||
Daily Results for 10/9/14
Lion II Vol and Tiger Vol had profitable short trades today.
|
|||||||
| (commission and slippage included, see Disclosures in top menu) | |||||||
| Swing Systems | # Trades | Net Profit | |||||
| FedSwing EMD | – | – | |||||
| FedSwing EMD-A | – | – | |||||
| FedSwing EMD-B | – | – | |||||
| FedSwing ES | – | – | |||||
| FedSwing TF | – | – | |||||
| FedSwing TF-A | – | – | |||||
| FedSwing TF-B | – | – | |||||
| FedSwing YM | – | – | |||||
| MeanSwing II EMD | – | – | |||||
| MeanSwing II EMD-A | – | – | |||||
| MeanSwing II EMD-B | – | – | |||||
| MeanSwing II ES | – | – | |||||
| MeanSwing II TF | – | – | |||||
| Portfolios | # Trades | Net Profit | |||||
| Index Trader I | 1 | $810 | |||||
| Index Trader II | 1 | $810 | |||||
| Index Trader III | 2 | $1,860 | |||||
| Index Trader IV | 2 | $1,860 | |||||
| Index Trader V | 2 | $1,860 | |||||
| Index Trader I-A | 1 | $620 | |||||
| Index Trader II-A | 1 | $620 | |||||
| Index Trader III-A | 2 | $1,630 | |||||
| Index Trader IV-A | 2 | $1,630 | |||||
| Index Trader V-A | 2 | $1,630 | |||||
| Index Trader I-B | 1 | $870 | |||||
| Index Trader II-B | 1 | $870 | |||||
| Index Trader III-B | 2 | $1,860 | |||||
| Index Trader IV-B | 2 | $1,860 | |||||
| Index Trader V-B | 2 | $1,860 | |||||
| For more information go to | |||||||
| www.trendfindertrading.com | |||||||
Daily Results for 10/8/14
Trendfinder’s emini futures trading systems did not have any closed trades today.
Daily Results for 10/7/14
Lion II Vol had a profitable short trade today.
Note: for those trading FedSwing EMD or TF, there was an incorrect entry today. I instructed brokers to close the trade so you may see an extra trade on your statement. I discovered a code error when I made an update last week. It is fixed now. I am sending them corrected code today. I apologize for this error.
| Daily Hypothetical Results (trades that exited today) | |||
| (commission and slippage included, see Disclosures in top menu) | |||
| Swing Systems | # Trades | Net Profit | |
| FedSwing EMD | – | – | |
| FedSwing EMD-A | – | – | |
| FedSwing EMD-B | – | – | |
| FedSwing ES | – | – | |
| FedSwing TF | – | – | |
| FedSwing TF-A | – | – | |
| FedSwing TF-B | – | – | |
| FedSwing YM | – | – | |
| MeanSwing II EMD | – | – | |
| MeanSwing II EMD-A | – | – | |
| MeanSwing II EMD-B | – | – | |
| MeanSwing II ES | – | – | |
| MeanSwing II TF | – | – | |
| Portfolios | # Trades | Net Profit | |
| Index Trader I | 1 | $860 | |
| Index Trader II | 1 | $860 | |
| Index Trader III | 1 | $860 | |
| Index Trader IV | 1 | $860 | |
| Index Trader V | 1 | $860 | |
| Index Trader I-A | 1 | $850 | |
| Index Trader II-A | 1 | $850 | |
| Index Trader III-A | 1 | $850 | |
| Index Trader IV-A | 1 | $850 | |
| Index Trader V-A | 1 | $850 | |
| Index Trader I-B | 1 | $790 | |
| Index Trader II-B | 1 | $790 | |
| Index Trader III-B | 1 | $790 | |
| Index Trader IV-B | 1 | $790 | |
| Index Trader V-B | 1 | $790 | |
| For more information go to | |||
| www.trendfindertrading.com | |||
Daily Results for 10/6/14
Trendfinder’s emini futures trading systems did not have any closed trades today.
Weekly Results – week ending 10/3/14
This was a tough week for the swing systems. For more commentary please see this blog post.
| Weekly Hypothetical Results (trades that exited this week) | |||
| (commission and slippage included, see Disclosures in top menu) | |||
| Swing Systems | # Trades | Net Profit | Month-to-date |
| FedSwing EMD | 1 | $(3,040) | $(3,040) |
| FedSwing EMD-A | 1 | $(3,040) | $(3,040) |
| FedSwing EMD-B | 1 | $(3,040) | $(3,040) |
| FedSwing ES | 1 | $(2,208) | $(2,208) |
| FedSwing TF | 1 | $(3,040) | $(3,040) |
| FedSwing TF-A | 1 | $(3,040) | $(3,040) |
| FedSwing TF-B | 1 | $(3,040) | $(3,040) |
| FedSwing YM | – | – | – |
| MeanSwing II EMD | 1 | $(4,190) | $(4,190) |
| MeanSwing II EMD-A | 1 | $(4,160) | $(4,160) |
| MeanSwing II EMD-B | 1 | $(4,200) | $(4,200) |
| MeanSwing II ES | 1 | $43 | $43 |
| MeanSwing II TF | 1 | $280 | $280 |
| Portfolios | # Trades | Net Profit | Month-to-date |
| Index Trader I | 3 | $(2,840) | $(2,840) |
| Index Trader II | 4 | $(7,030) | $(7,030) |
| Index Trader III | 6 | $(9,238) | $(9,238) |
| Index Trader IV | 7 | $(9,195) | $(9,195) |
| Index Trader V | 8 | $(12,235) | $(12,235) |
| Index Trader I-A | 4 | $(3,740) | $(3,090) |
| Index Trader II-A | 5 | $(7,900) | $(7,250) |
| Index Trader III-A | 7 | $(9,988) | $(9,338) |
| Index Trader IV-A | 8 | $(9,945) | $(9,295) |
| Index Trader V-A | 9 | $(12,985) | $(12,335) |
| Index Trader I-B | 4 | $(3,810) | $(3,160) |
| Index Trader II-B | 5 | $(8,010) | $(7,360) |
| Index Trader III-B | 6 | $(10,218) | $(9,568) |
| Index Trader IV-B | 7 | $(10,175) | $(9,525) |
| Index Trader V-B | 8 | $(13,215) | $(12,565) |
| Index Swing 2 | 2 | $(6,398) | $(6,398) |
| Index Swing 3 | 3 | $(9,438) | $(9,438) |
| Index Swing 4 | 4 | $(9,395) | $(9,395) |
| Index Swing 5 | 5 | $(12,435) | $(12,435) |
| Index Swing 6 | 5 | $(12,435) | $(12,435) |
| Index Swing 2-A | 2 | $(6,368) | $(6,368) |
| Index Swing 3-A | 3 | $(9,408) | $(9,408) |
| Index Swing 4-A | 4 | $(9,365) | $(9,365) |
| Index Swing 5-A | 5 | $(12,405) | $(12,405) |
| Index Swing 6-A | 5 | $(12,405) | $(12,405) |
| For more information go to | |||
| www.trendfindertrading.com | |||
Daily Results for 10/3/14
MeanSwing II exited long trades in the ES (S&P 500) and TF (Russell 2000) for small profits.
| Daily Hypothetical Results (trades that exited today) | |||
| (commission and slippage included, see Disclosures in top menu) | |||
| Swing Systems | # Trades | Net Profit | |
| FedSwing EMD | – | – | |
| FedSwing EMD-A | – | – | |
| FedSwing EMD-B | – | – | |
| FedSwing ES | – | – | |
| FedSwing TF | – | – | |
| FedSwing TF-A | – | – | |
| FedSwing TF-B | – | – | |
| FedSwing YM | – | – | |
| MeanSwing II EMD | – | – | |
| MeanSwing II EMD-A | – | – | |
| MeanSwing II EMD-B | – | – | |
| MeanSwing II ES | 1 | $43 | |
| MeanSwing II TF | 1 | $280 | |
| Portfolios | # Trades | Net Profit | |
| Index Trader I | 0 | $- | |
| Index Trader II | 0 | $- | |
| Index Trader III | 0 | $- | |
| Index Trader IV | 1 | $43 | |
| Index Trader V | 1 | $43 | |
| Index Trader I-A | 0 | $- | |
| Index Trader II-A | 0 | $- | |
| Index Trader III-A | 0 | $- | |
| Index Trader IV-A | 1 | $43 | |
| Index Trader V-A | 1 | $43 | |
| Index Trader I-B | 0 | $- | |
| Index Trader II-B | 0 | $- | |
| Index Trader III-B | 0 | $- | |
| Index Trader IV-B | 1 | $43 | |
| Index Trader V-B | 1 | $43 | |
| For more information go to | |||
| www.trendfindertrading.com | |||
Update for FedSwing and commentary on performance
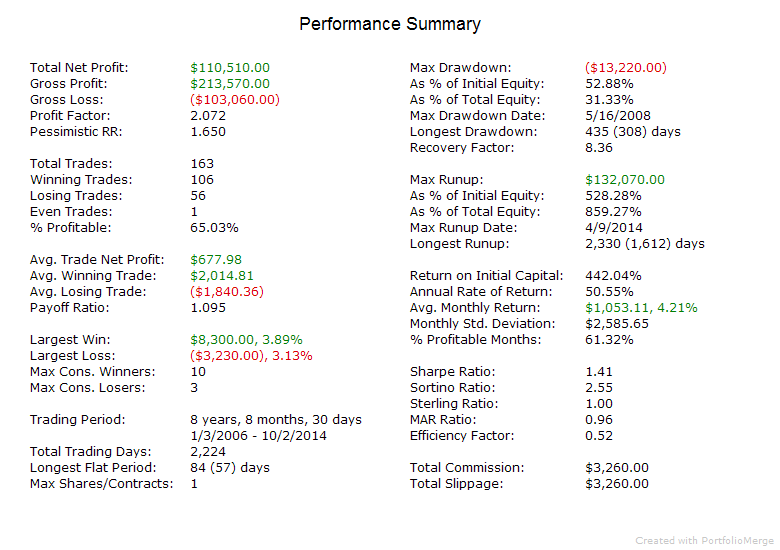
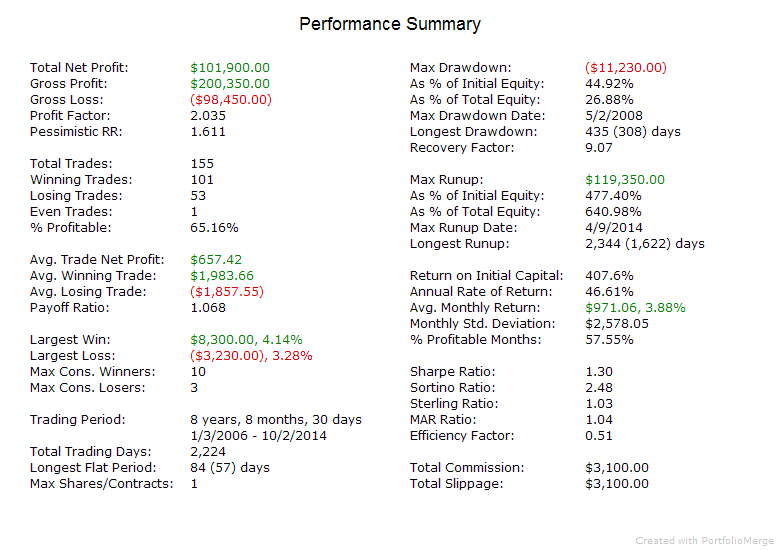
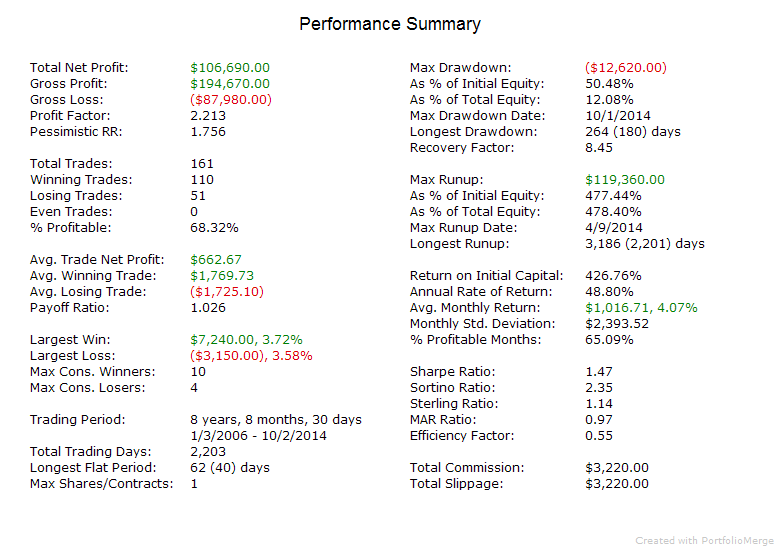
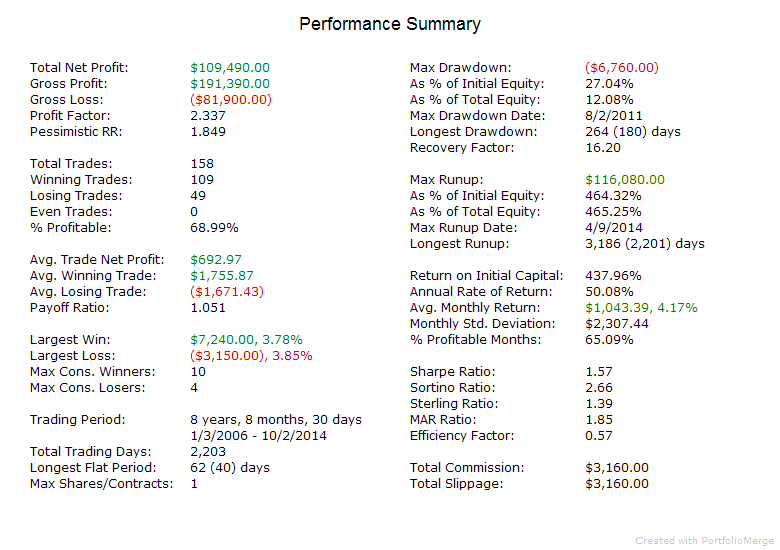
I discovered a minor tweak today that reduces losses for FedSwing. Instead of just waiting more than 3 days after a stop out to enter a trade in the same direction, it will now also require price to have reached an exit signal (MeanSwing already requires this). This simple revision has a very small effect on overall profit yet provides much better risk control. I am applying this as a walk forward update – all performance reports will use this updated version starting tomorrow. If you would like to see backtest results utilizing this update on all past data (1/1/2006-present) you can download the reports here. The two markets this update has the biggest effect on are the EMD (S&P MidCap) and the TF (Russell 2000). Comparative performance summaries are shown below.
FedSwing EMD
FedSwing EMD Updated
FedSwing TF
FedSwing TF Updated
Performance for many swing systems has been poor recently. The primary reason is that the strong bull market has lost steam. We aren’t getting the bounces from pullbacks that we were getting. Since we are still in a bull market by most measures, the swing systems have been taking mostly long trades. That appears to be changing.
The S&P 500 and Dow are the strongest of the markets the swing systems trade. The large caps have stayed well above their 200 day moving average but have been going sideways the last two months or so. Therefore the long swing trade results have not been as good as previous years but still doing okay for the S&P 500 and Dow.
The Russell 2000 has clearly been lagging and is under the 200 day moving average. This means it is very possibly starting a bearish trend. Since the trend has been rolling over the swing systems have had poor results for the Russell 2000. Going forward MeanSwing II TF will primarily be taking short trades on the Russell 2000 unless it moves back above the 200 day moving average.
The S&P MidCap is just below the 200 day moving average. A large bounce up from here may maintain its bullish trend, but if it declines further over the next few weeks it will be in a bearish trend. Because its bullish momentum has faded, the long swing trades have underperformed. If it continues to stay under the 200 day moving average MeanSwing II EMD will be mostly taking short trades.
I have spent lots of time the past two months testing different swing systems, different parameters for the existing systems, and different combinations. Nothing has significantly improved results compared to what is already being used (however the FedSwing update described above will reduce risk going forward). Basically what I’ve found is that what is being used is still working, and we just are in the unfortunate situation of a relatively large drawdown due likely to the markets rolling over from a bull to a bear. I am in a large drawdown in my own account too (I use the same strategies) so I know the pain.
One change I made to the intraday systems at the end of July has paid off. They have mostly avoided the poor intraday trading conditions the past two months.
My opinion about what the future holds is as follows. I think a bearish trend will start when Quantitative Easing comes to an end (which may be as soon as November). However, the top may already be in with people preparing for the end of QE and due to the effects of tapering. With the money pump turned off, the markets will likely move even freer than now and volatility will rise. As volatility increases, the intraday systems will become more active and should start providing profits again. The swing systems may struggle a little until we are fully turned over into bear mode. However they may do fine since they already have the potential for some short trades in October in addition to long trades.